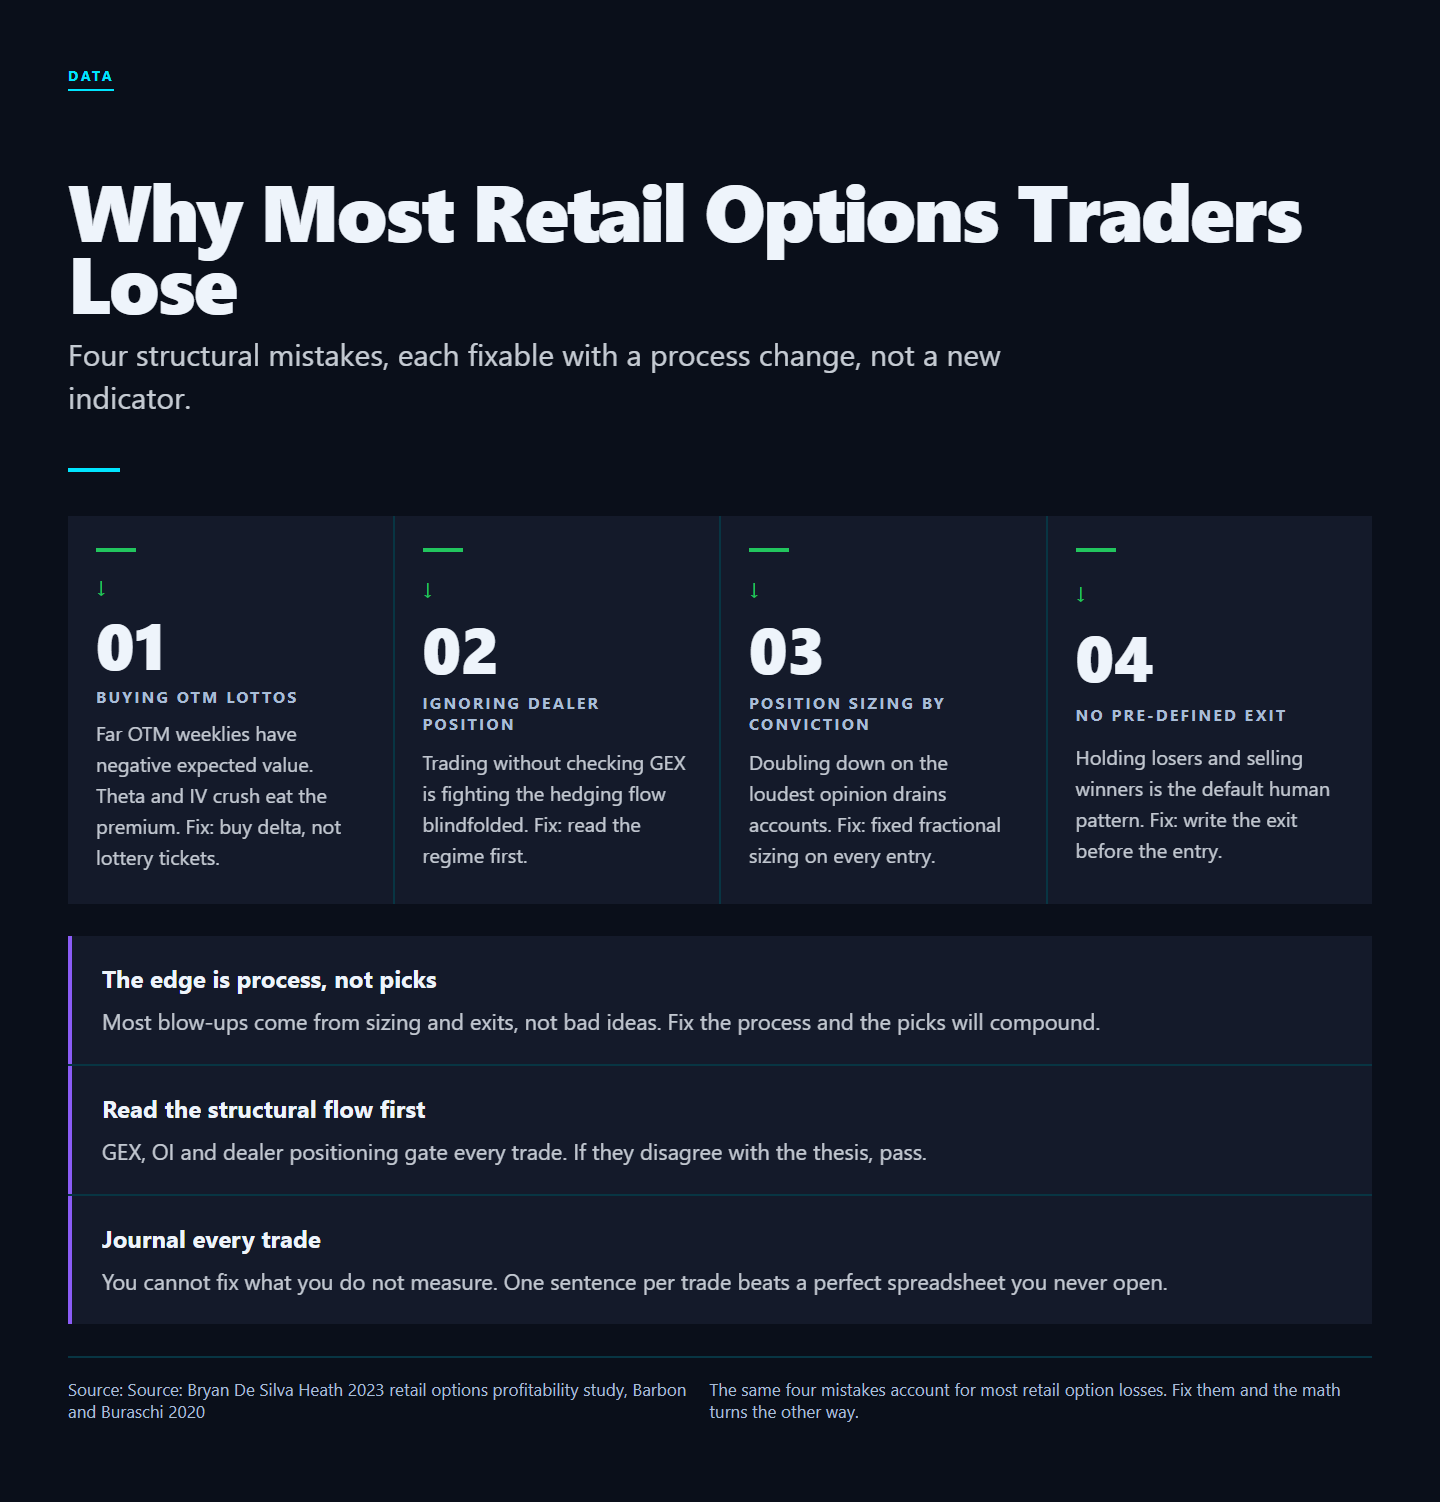
TL;DR. Academic research on retail options trading (Bryan, De Silva, and Heath 2023) estimates that retail traders pay billions of dollars annually in trading costs and lose performance to bid-ask spreads, dealer hedging dynamics, and theta decay. The losses are not from manipulation. They are from a structural informational asymmetry: dealers see net positioning and hedge mechanically; retail sees prices and headlines. Closing the gap requires reading positioning data, not better chart patterns.
Software Automated Research Team | Published 2025-04-23
The Honest Math
Academic work on retail options trading is unambiguous. Bryan, De Silva, and Heath (2023) "The Wisdom of the Robinhood Crowd Trades Options" estimates that retail options traders pay billions annually in costs and lose meaningful performance to bid-ask spreads, dealer hedging, and theta decay. That is not from manipulation. It is from a structural informational asymmetry: dealers can see net positioning, see flow direction, and hedge mechanically; retail traders see prices, charts, and headlines.
The losses are predictable because the structure is predictable. Retail buys premium into trending moves (the worst price). Retail sells premium into vol expansions (the worst price). Retail sizes by conviction-as-feeling rather than conviction-as-data. Each of these patterns is exactly what dealer-side desks would design for retail to do, if they could design retail behaviour. The desks did not design it; the structure produced it.
The Four Structural Mistakes
1. Trading direction without positioning
A bullish chart pattern means nothing if dealers are positioned to defend the level overhead. Most retail traders never know whether they are trading with flows or against them. A breakout above a heavy call wall in a positive-gamma regime is a sell. A breakout above the same wall in a negative-gamma regime is a buy. The chart pattern is identical; the right trade is opposite. Without positioning data you cannot tell the difference.
2. Buying near-dated options on momentum
Theta and gamma profile mean buying ATM weeklies into a trending move is buying premium at the worst possible point on the curve. Implied vol is highest, theta is steepest, and the convex payoff that attracted you also evaporates in days if the move stalls. The math is unforgiving: a weekly ATM call you bought 1% from the money for $2.50 can be worth $0.40 the next day on a tiny adverse move. Sizing for the home run is sizing for the blow-up.
3. Sizing emotionally
Position size scaling with conviction-as-feeling rather than conviction-as-data leads to outsized losses on the trades that "felt right." The conviction trades that fail are the catastrophic-loss tail of a retail account. The mediocre trades that win do not compensate because they were smaller. Result: the account bleeds through high-conviction blow-ups while the average trade is profitable. This is the textbook reason retail option accounts end years down despite winning a majority of trades.
4. Ignoring volatility regime
Selling premium in a positive GEX regime is dramatically different from selling it in a negative GEX regime. The first is a high-probability income strategy. The second is picking up nickels in front of a steamroller. Most retail traders never distinguish; they sell premium in both regimes using the same sizing and get steamrolled in negative-gamma weeks.
What the Fix Actually Looks Like
The fix is not a secret indicator. It is a workflow:
- Establish regime first. GEX, vanna posture. Are dealers absorbing or amplifying flows today?
- Identify positioning structures. Walls, magnets, gamma flips. Where will price find friction or acceleration?
- Confirm with flow. Is institutional positioning aligned with your directional read?
- Choose an option structure that fits the regime. Debit (long premium) in negative gamma where moves extend. Credit (short premium) in positive gamma where moves revert.
- Size based on distance to invalidation. Tight stop = larger position. Wide stop = smaller position. Account risk per trade stays constant.
- Manage with predefined exits. Trailing stop, target, time-based exit, or rules-based scale-out. Never improvise in the heat of the move.
A side-by-side: same chart, different regimes, different trades
SPX is at 5500, just broke above 5495 resistance on rising volume. The chart pattern is bullish breakout.
Positive-gamma regime (GEX +$2.1B, call wall at 5530): the breakout will likely fail or stall at 5510-5525 because dealers sell into strength to neutralize their hedge. Right trade: short the breakout near 5510 with a stop above 5530, target 5485-5495 mean reversion.
Negative-gamma regime (GEX -$1.4B, zero-gamma at 5485): the breakout will likely accelerate because dealers must buy to hedge their short calls as price extends. Right trade: long the breakout near 5500 with a stop below 5485, target 5530+.
Same chart, opposite trades. The positioning regime is the deciding variable, not the chart pattern.
The role of community
Reading positioning data alone is hard. Reading it in real-time while live trading is harder. Reading it in the same channel where a senior analyst is calling out what they see is dramatically easier. This is why options trading communities exist. The data layer (the GammaEdge bot) does the mechanical math. The community (the Discord) provides the human pattern recognition. The operator (Taylor Drake) provides the daily anchor. The combination is what turns data into trades.
Why This Is the Whole Pitch for GammaEdge
None of this is unknowable. All of it is just hard to assemble alone. The platform exists because retail traders need the same positioning data dealers use, packaged in a way that turns it into decision input rather than academic curiosity.
The 4.94-star rating and the 200+ active members are not from hype. They are from traders who finally had the data to see what was actually moving the tape, and who built workflows that compound instead of cycle through wins and blow-ups. The operator publishes a 30-day refund guarantee: complete onboarding, follow the framework, and if you do not have one $150-or-larger profitable trade in your first month, you get every dollar back.
The Realistic Outcome
Joining a tools-and-community service does not make anyone profitable overnight. What it does is close the structural gap between you and the dealer on the other side of your trades. Whether you turn that into edge depends on discipline, but you cannot turn information you do not have into edge under any circumstances.
That is the trade GammaEdge offers: pay for the data layer, do the work on top of it, stop donating to the people who can already see what you are doing.
FAQ
How long does the workflow take to learn?
Most members report 2-4 weeks to be comfortable reading the morning bot output and forming a trade plan. Mastery (knowing exactly when to break the rules and when to follow them) takes 6-12 months.
Do I need to trade every day?
No. The workflow filters out a meaningful share of marginal-conviction trades, which means active days are often fewer than chart-only traders are accustomed to. That is a feature, not a bug.
What capital do I need to start?
A workable defined-risk options account starts around $5,000-$10,000 in the US (assuming margin approval for spreads). For shares-only swing trades, less. Position-sizing math is the same at any account size; the absolute dollar P&L just scales.
What happens when the workflow fails?
Every workflow has losing weeks. The point of the framework is to lose less when wrong and capture more when right, not to never lose. A losing week with the framework looks like 2-3 modest losses that aggregate to <1% account drawdown. A losing week without the framework can look like a single 5%+ blow-up trade.
Sources and further reading
- Bryan, K., De Silva, T., and Heath, D. (2023). "The Wisdom of the Robinhood Crowd Trades Options." Working paper.
- Barber, B., Lee, Y.-T., Liu, Y.-J., Odean, T., and Zhang, K. (2020). "Learning, Fast or Slow." Review of Asset Pricing Studies.
- Garleanu, Pedersen, and Poteshman (2009) on demand-based option pricing.
- GammaEdge platform documentation at gammaedge.com.
Verdict
The reason most retail options traders lose is not lack of intelligence or work ethic. It is lack of data plus the wrong sequencing of decision-making. Fix the sequencing (positioning first, chart second) and add the missing data (dealer flows, GEX, walls) and the win rate climbs measurably. The framework is replicable. The discipline is the only hard part. If you are going to trade options in 2026, do not show up to a knife fight with a chart pattern.
What to do next
Stop trading the chart. Trade the flow.
WHAT
GammaEdge: the Whop community Taylor Drake runs. GEX dashboard, Discord bot, daily 9 a.m. ET session, wheel + P-Trans+GEX frameworks.
WHY
Same dealer-positioning data hedge funds pay 10x more for, packaged for active retail options traders.
HOW
14-day free trial. $0 charged today. 30-day refund: do not make a $150 trade in month one, get every dollar back.
Affiliate disclosure: GammaEdge is a paid product. We may earn a commission if you join through our Whop link, at no extra cost to you. All editorial assessments above are independent.