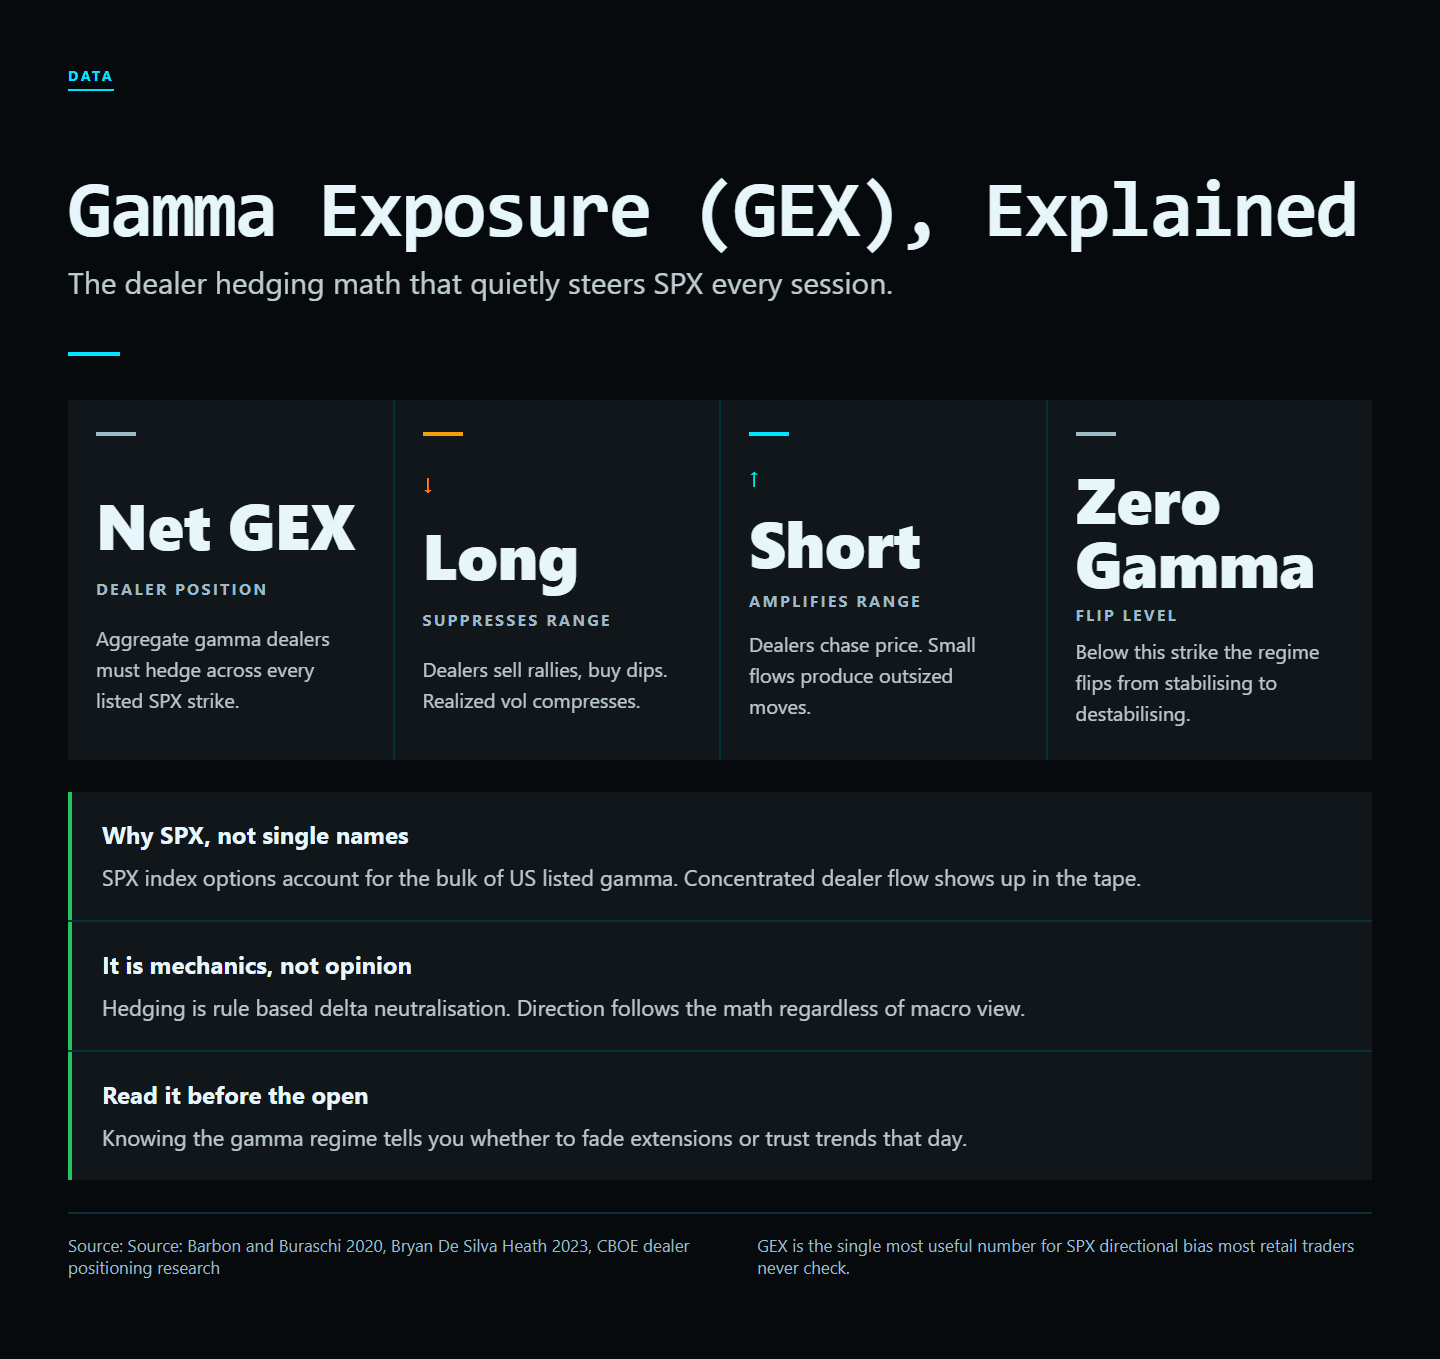
TL;DR. Gamma exposure (GEX) is the net dollar gamma across all open SPX options. It drives the dealer-hedging flows that pin price to strikes, cap rallies at call walls, and amplify selloffs through zero-gamma levels. Traders who read GEX before they read the chart consistently make fewer low-probability trades.
Software Automated Research Team | Published 2025-02-12
The Hidden Hand Behind Intraday Price Action
When SPX pins to a strike on Friday afternoon or accelerates straight through a level mid-morning, it isn't fundamentals doing the work. It's dealer gamma. Market makers who sell options to retail and institutional buyers must continuously hedge their books, and that hedging flow is mechanical, predictable, and visible if you know where to look. Academic work on dealer positioning (Barbon and Buraschi 2020, "Gamma Fragility") finds that dealer gamma exposure explains a statistically significant portion of intraday S&P 500 variance, particularly in the final hour of trading.
The implication is uncomfortable for traders who rely on chart patterns alone. A meaningful share of the noise you see is not retail sentiment or news flow. It is the mechanical rebalancing of hedge books across a handful of large dealers. If you do not see what they are forced to do, you are guessing.
What Gamma Actually Measures
Gamma is the rate of change of delta. When you own a call, your delta grows as the underlying rises. The dealer on the other side of that trade has negative gamma, which means their hedge requirement gets worse the more the underlying moves against them. To stay neutral, they must buy as price rises and sell as price falls. That mechanical rebalancing amplifies every move.
When dealers are net long gamma, the opposite happens. They sell into strength and buy into weakness, dampening volatility and creating the "pinning" behavior traders notice around major option strikes on expiration day. The two regimes feel completely different on the tape: long-gamma days look like grinding ranges with shallow pullbacks, while short-gamma days look like one-way trends with gaps that do not fill.
How dealer hedging cascades into price
A simple example. Dealers are short 100,000 SPY call contracts at the 550 strike with 0 days to expiration. The combined delta exposure is roughly equivalent to being short 5 million shares of SPY. To hedge, dealers buy 5 million shares. Now SPY ticks from 549 to 551. The 550 calls flip from out-of-the-money to in-the-money, and dealer delta exposure swings from short 5 million shares to short closer to 9 million. To stay neutral, dealers buy another 4 million shares in minutes. That buying pressure is itself the move. The chart you see is the hedge.
The Greek hierarchy
Delta tells you how much an option moves with the underlying. Gamma tells you how fast delta changes. Gamma exposure aggregates that across every open contract for an index. Most retail traders learn delta and stop. Professional desks build their position around gamma because gamma is what forces flows.
Why GEX Is the Most Important Number Most Traders Ignore
Aggregate Gamma Exposure (GEX) is the net dollar gamma across all open SPX options. A positive GEX environment means dealers will absorb shocks. Expect mean reversion, tight ranges, and slow drift. A negative GEX environment means dealers amplify shocks. Expect trend days, gaps that do not fill, and volatility expansions.
The transition between these regimes, the "zero gamma" level, is one of the most actionable lines on the chart. Above it, sell-strength is the working bias. Below it, sell-weakness becomes dangerous because dealer flows are working against you. Several published studies of S&P 500 intraday behaviour find statistically different return distributions on positive-GEX days versus negative-GEX days, with the most pronounced difference in realized volatility.
Positive GEX days
Volatility is sold mechanically. Pullbacks are shallow. Range trades work. Breakouts often fail because dealers sell into them. The trader who fights this and chases breakouts donates premium to the desks on the other side of their trades.
Negative GEX days
Volatility is bought mechanically. Selloffs accelerate. Reversals are rare. Range trades fail. Premium sellers get steamrolled. The trader who sees the regime and switches to directional, defined-risk structures wins. The trader who keeps selling premium against the move because "it always reverts" finds out the hard way that mechanical flows do not care about your mean.
Gamma Walls and Magnets
Specific strikes with massive open interest become gamma walls. As price approaches, hedging flows intensify, often creating reversals at predictable levels. The largest call wall above price acts as resistance. The largest put wall below acts as support. These are not technical levels in the usual sense. They are mechanical commitments by dealers to hedge in a specific direction at a specific price.
A magnet is a different beast. A magnet is the strike toward which price is being pulled by net hedging flow on expiration day. When you hear traders say "SPX is pinning 5500", they are describing magnet behaviour. The pin is not voluntary. Dealers near a heavy-OI strike are forced to keep price close to it as their delta swings on every move.
How to spot the wall before the move
Pull the open interest by strike for the nearest expiration. Multiply each strike's OI by 100 by gamma per contract. Sum calls separately from puts. The strikes with the largest absolute gamma exposure are the walls. The strike with the heaviest dealer commitment near current price is your magnet. This is the math the GammaEdge Discord bot runs in milliseconds when a member types the GEX command, but you can do it yourself with end-of-day options data and a spreadsheet.
How To Actually Use This
Most retail traders look at gamma data once and dismiss it as "too complex." The traders who win with it focus on three things:
- Regime first. Is GEX positive or negative today? That sets your bias before you look at any chart.
- Walls second. Identify the call wall above and put wall below. Trade between them, not through them, unless flows confirm a breakout.
- Flow third. Use intraday gamma flips and the largest dealer hedging zones as decision points, not entries by themselves.
The order matters. Regime sets the type of trade you should be looking for. Walls set the entry and target levels. Flow confirms or contradicts. Reverse the order and you end up chasing breakouts in long-gamma regimes and selling premium into selloffs in short-gamma regimes, which is exactly the donating pattern dealers harvest.
A worked example: positive-GEX morning
SPX opens at 5470, GEX is +$2.1B, the call wall sits at 5500, the put wall at 5440. Trade plan: short bounces toward 5495, long pullbacks toward 5445, expect a 30-50 point range through the session, avoid 0DTE long-premium plays. Outcome: dealers sell into every move above 5490, buy every dip below 5450, and SPX closes inside the range. This is what positive-GEX days look like over and over.
A worked example: negative-GEX morning
SPX opens at 5470, GEX is -$1.4B, zero-gamma sits at 5485, put wall at 5400. Trade plan: short rallies into 5485 with defined risk, expect downside acceleration if 5460 breaks, switch to long-premium directional structures, avoid premium-selling. Outcome: every test of 5485 fails, the break of 5460 accelerates, and SPX closes near 5410. Negative-GEX days reward directional traders and punish range traders.
Common mistakes traders make with GEX
- Trading the absolute number, not the regime. A GEX of +$500M and a GEX of +$3B are both "positive" but behave differently. Watch the trend and the magnitude.
- Ignoring time decay. Charm and vanna shift gamma profiles intraday. A positive-GEX morning can flip negative by afternoon if a big position closes.
- Treating walls as static support and resistance. Walls move as OI shifts and as price approaches them. A wall at 5500 with 80,000 contracts can dissolve to a wall at 5510 with 30,000 contracts in two trading hours.
- Using only SPX GEX for single-name trades. NVDA, TSLA, and other liquid single names have their own GEX profiles that can be wildly different from the index.
- Selling premium against walls in negative-gamma regimes. Walls hold in long-gamma regimes. They break, often violently, in short-gamma regimes.
How GammaEdge surfaces GEX in practice
Inside the GammaEdge platform and Discord, members run a GEX command at the start of every session. The output is a chart of net gamma exposure by strike, the current zero-gamma level, the largest call and put walls, and the regime classification. Throughout the day the Discord posts intraday updates when conditions shift materially, and the operator (Taylor Drake) walks through the implications live at 9 a.m. ET on X Spaces.
The data comes from ThetaData and EdgeRater, two institutional options feed providers. That matters because retail GEX calculators built off Yahoo or free CBOE end-of-day data are stale and incomplete. GEX is sensitive to intraday OI changes, and the difference between a 9 a.m. snapshot and an 11 a.m. snapshot can be the difference between a profitable trade and a losing one.
FAQ
Is GEX the same as max pain?
No. Max pain is the strike where option sellers profit most on expiration. GEX is the net dollar gamma at every strike, which determines dealer hedging direction. They sometimes coincide, but they measure different things. Max pain is an end-of-day target. GEX is a live regime indicator.
Can I trade GEX without options?
Yes, and many GammaEdge members do exactly that. GEX tells you the volatility regime and the structural support/resistance levels. You can trade SPY or QQQ shares around those levels without ever touching an option contract.
How fast does GEX change intraday?
The dealer hedging profile shifts continuously as price moves and as new positions open. The largest GEX shifts happen around major events (FOMC, CPI, NFP), around large block trades, and at OPEX. On a normal session, GEX moves enough to revise levels every 30-60 minutes but rarely flips regime intraday.
Where can I see GEX without paying?
Free sources exist (SpotGamma publishes some end-of-day data; Reddit r/thetagang occasionally posts charts) but they are delayed, partial, and lack the institutional feed quality. For serious daily use, a paid platform or a self-built tool fed by ThetaData is the practical minimum.
Sources and further reading
- Barbon, A. and Buraschi, A. (2020). "Gamma Fragility." SSRN. The foundational academic work linking dealer gamma to S&P 500 intraday variance.
- CBOE research on 0DTE options volume and the rise of same-day expirations as a share of total SPX volume.
- SpotGamma educational materials on GEX measurement methodology.
- GammaEdge platform documentation at gammaedge.com.
Verdict
GEX is not a magic indicator. It is a structural map of where dealers are forced to buy and sell. Combined with regime awareness and basic risk management, it tightens entry levels, sharpens directional bias, and filters out a meaningful share of low-conviction trades. The traders who use GEX as their first read of the morning consistently report better trade selection. The traders who treat it as a confirmation tool layered on top of chart patterns report less benefit, because they are still letting the chart drive the decision. If you are going to trade SPX, SPY, or any liquid optionable name in 2026 and beyond, GEX deserves to be in your morning routine.
What to do next
Stop trading the chart. Trade the flow.
WHAT
GammaEdge: the Whop community Taylor Drake runs. GEX dashboard, Discord bot, daily 9 a.m. ET session, wheel + P-Trans+GEX frameworks.
WHY
Same dealer-positioning data hedge funds pay 10x more for, packaged for active retail options traders.
HOW
14-day free trial. $0 charged today. 30-day refund: do not make a $150 trade in month one, get every dollar back.
Affiliate disclosure: GammaEdge is a paid product. We may earn a commission if you join through our Whop link, at no extra cost to you. All editorial assessments above are independent.