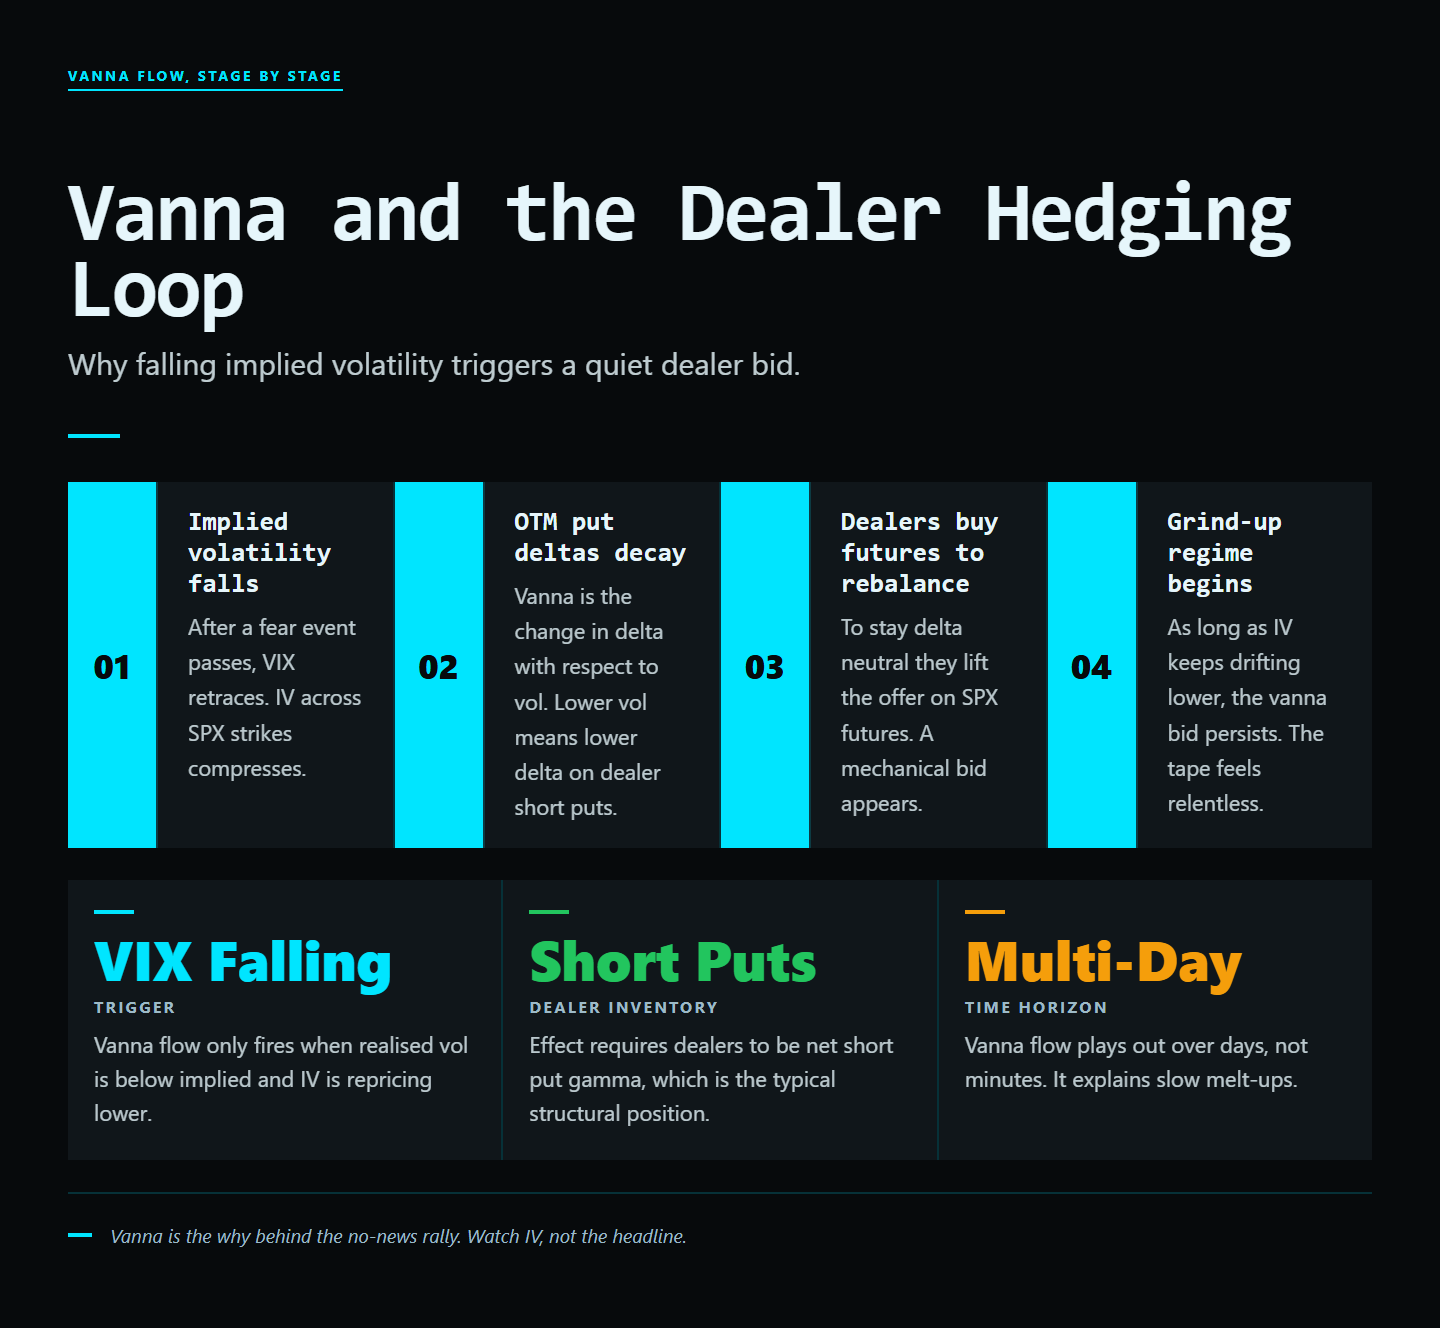
TL;DR. Vanna measures how delta changes when implied volatility changes. Because dealers are systematically short volatility, every IV shift triggers a delta-rebalancing flow. That flow is the FOMC drift, the post-CPI rally, the VIX-spike acceleration, and the OPEX unwind. Read vanna at the open and you have read most of the next 48 hours.
Software Automated Research Team | Published 2025-03-11
The Greek Almost No One Trades
Vanna is the rate of change of delta with respect to implied volatility. In plain English: when the market's expectation of future movement shifts, dealer hedges shift with it, independent of any actual price change in the underlying. Most retail options education stops at delta-gamma-theta-vega. Vanna lives one layer deeper, which is why most retail traders have never heard of it and why dealer flows around macro events look mysterious to anyone who has not.
The mechanism is documented in derivatives literature going back to Bates 1996 and formalized by Garleanu, Pedersen, and Poteshman 2009 in "Demand-Based Option Pricing." Dealer hedging is not a sideshow. It is a primary driver of intraday index moves around scheduled volatility events.
The Vanna Loop
Dealers are typically short volatility (they have sold options to clients). When IV falls, say after a CPI print resolves favorably, dealer puts lose delta and dealer calls gain delta. To stay neutral, dealers buy the underlying. This is the source of the post-event rally that often dwarfs the actual news.
The opposite happens on a VIX spike. Dealer puts gain delta, dealer calls lose delta, and the hedging response is to sell the underlying, adding to the panic that caused the IV spike in the first place. Vanna is reflexive: the hedging flow itself moves the underlying, which moves IV, which triggers more vanna flow. In short-gamma regimes this loop can produce some of the most violent intraday moves you will ever see.
Why dealers are systematically short volatility
Retail and institutional clients are net buyers of options for hedging and speculation. Dealers fill the other side. Aggregate dealer inventory is therefore short options across most strikes most of the time. Short-options inventory is short volatility by definition. Every move in IV cascades into hedge rebalancing because dealers cannot let exposure run unhedged.
Why This Matters Around Macro Events
The most reliable vanna-driven setups happen around scheduled volatility events: FOMC, CPI, NFP, OPEX. Implied vol gets bid into the event, dealer hedges accumulate one way, then unwind violently when the event resolves. The "FOMC drift", the post-decision rally that happens roughly two-thirds of the time historically, is largely a vanna phenomenon. Pre-FOMC vol gets bid as everyone hedges; post-FOMC vol crushes if the decision is benign; vanna flow pushes dealers to buy the underlying.
The pre-event setup pattern
In the 5-10 days before FOMC, CPI, or NFP, watch for: (1) implied vol bid above realized vol by an unusual margin, (2) skew flattening as protective puts get bought, (3) put OI building in front-month expirations. All three together signal heavy dealer-side put inventory. When the event resolves benignly, dealers must buy the underlying to neutralize the delta their disappearing put exposure releases.
The post-event unwind
The vanna unwind starts within minutes of the event resolving. The biggest moves happen in the first 15-30 minutes as IV crushes by 5-15 vol points. The second-largest moves happen over the next 24-48 hours as residual hedges peel off. A patient trader who waits for the IV crush to start and rides the 48-hour drift extracts a more reliable edge than the trader who tries to predict the event direction itself.
Reading Vanna Inside GammaEdge
The GammaEdge Discord bot exposes net vanna alongside gamma. You can see, at a glance, which direction dealer flows will push if IV compresses or expands. That single piece of information lets you frame whether a "boring" market is set up to drift higher or grind lower over the next 24-48 hours. The operator (Taylor Drake) walks through pre-event vanna posture in the 9 a.m. ET premarket Space on X (@GammaEdges) on FOMC days.
Three Setups That Lean on Vanna
- Post-event drift. When IV is elevated into a known event and resolves benignly, vanna flows usually push the underlying higher over 24-48 hours. Sized correctly, this is one of the highest-probability setups in the index trader's playbook.
- Pre-OPEX positioning. Heavy hedging demand pre-OPEX often unwinds in the days after, creating an asymmetric setup. The pattern is most reliable in months with major macro catalysts in the OPEX week.
- VIX spike fades. Vanna feedback loops typically reverse within a session or two unless realized vol confirms. A VIX spike on no news is the textbook fade, but only if vanna positioning supports the reversal.
What kills a vanna trade
- Surprise hawkish FOMC. If the event resolves badly (hawkish surprise, inflation print above consensus), IV stays elevated and the unwind never happens. Always have an invalidation level.
- Realized vol confirms. If the market sells off hard after a VIX spike and realized vol prints high, the vanna fade is dead. Wait for IV to start compressing before sizing the trade.
- Trading the event itself. The vanna edge is in the post-event hours, not the event minute. Holding through the announcement is binary-bet behaviour and not what vanna trading is about.
A worked example: post-FOMC vanna drift
FOMC Wednesday, 2 p.m. ET. Pre-meeting IV on SPX 30-day options is 22%, realized is 14%. Skew is flat. Net dealer vanna is sharply negative (dealers are short volatility into the event). The Fed announces a hold-and-pause. IV crushes from 22% to 16% within 30 minutes. Vanna flow forces dealers to buy SPY into the close. SPY rallies 0.8% from 2:15-4:00 p.m. Over the next 24 hours, residual unwinds push SPY another 0.6% higher. Total drift: 1.4% from the announcement to the next-day close.
This is the textbook pattern. Inside GammaEdge, members enter long SPY (or short-dated long calls) at 2:15 p.m. with a stop just below the announcement print and a target at the upper Bollinger Band or a known structural level. Win rate on this setup over multiple years is published in the operator's wheel/swing combo materials.
FAQ
Why does vanna show up most at FOMC?
Because FOMC has the largest concentrated IV bid of any calendar event. The bigger the IV bid, the bigger the vanna unwind when the event resolves. CPI and NFP also produce vanna patterns but they are smaller in magnitude.
Does vanna work on single names?
Yes for the most liquid single names (NVDA, TSLA, AAPL) around their earnings reports. The pattern is identical: pre-earnings IV crush triggers vanna unwind that produces a post-earnings drift in the direction of the trapped dealer inventory.
How do I measure vanna myself?
Net dealer vanna = sum across all open contracts of (vanna per contract -- OI -- 100 -- position direction). Position direction is implicit dealer-short on most strikes. The GammaEdge bot calculates this in milliseconds. Building it from end-of-day data manually is tractable but tedious.
How does vanna interact with charm?
Charm is delta decay over time. Vanna is delta sensitivity to IV. They can amplify each other (positive charm + favorable vanna = accelerated drift) or cancel each other (positive charm but adverse vanna = choppy day). The cleanest setups have both pointing the same direction.
Sources and further reading
- Garleanu, N., Pedersen, L. and Poteshman, A. (2009). "Demand-Based Option Pricing." Review of Financial Studies.
- Bates, D. (1996). "Jumps and Stochastic Volatility." Review of Financial Studies. The foundational vanna/vomma analysis.
- JP Morgan equity derivatives research on FOMC vanna flows.
- GammaEdge vanna documentation at gammaedge.com.
Verdict
Vanna is invisible to chart traders and obvious to dealer-flow traders. The asymmetry is the edge. Read net vanna at 9 a.m. on FOMC day and you have a multi-day directional bias that does not depend on guessing the Fed. Add gamma regime as the second filter and you have one of the highest-probability setups in macro-event trading. The traders who internalize vanna stop trying to predict the event and start trading the hedge.
What to do next
Stop trading the chart. Trade the flow.
WHAT
GammaEdge: the Whop community Taylor Drake runs. GEX dashboard, Discord bot, daily 9 a.m. ET session, wheel + P-Trans+GEX frameworks.
WHY
Same dealer-positioning data hedge funds pay 10x more for, packaged for active retail options traders.
HOW
14-day free trial. $0 charged today. 30-day refund: do not make a $150 trade in month one, get every dollar back.
Affiliate disclosure: GammaEdge is a paid product. We may earn a commission if you join through our Whop link, at no extra cost to you. All editorial assessments above are independent.