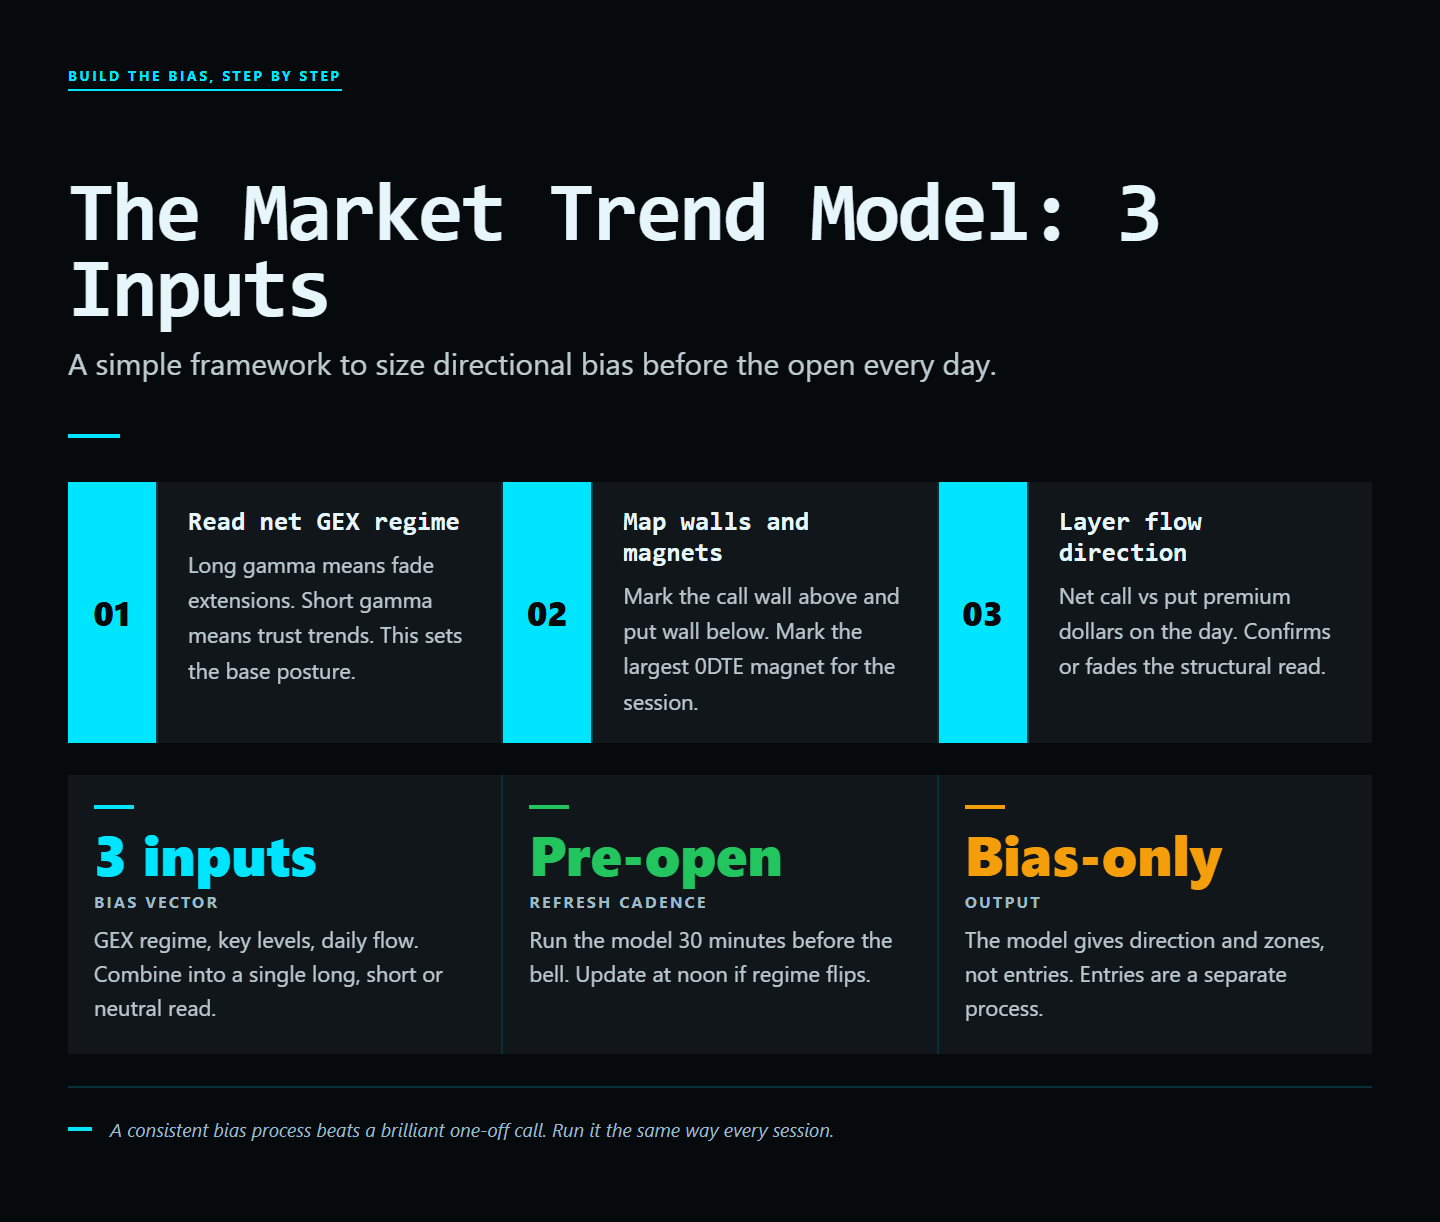
TL;DR. Most directional models react to price after the obvious move is already gone. The GammaEdge Market Trend Model integrates three signal sets that lead price: net dealer gamma regime, aggregated dealer flow, and cross-asset breadth. Combined, they produce a weekly directional bias with historical conditional probabilities attached. It does not pick entries; it sets the playing field on which entries get chosen.
Software Automated Research Team | Published 2025-04-09
Why Most Directional Models Fail
The trader's bookshelf is full of "trend" models: moving average crossovers, breadth oscillators, sentiment composites, MACD divergences, RSI extremes. The problem with most is that they react to price rather than to the structures that move price. By the time the model flips, the obvious part of the move is already done. You end up entering at the second or third bar of a leg that started 50 minutes ago and exiting just before the reversal.
The deeper issue: price-derived indicators have a single information source (price itself) processed through different mathematical filters. Lagging price with one filter or another does not solve the lag problem; it just dresses it up. To lead price, you need data that is not derived from price. Dealer-positioning data fits because it reflects forced future flows, not historical bars.
The Three Inputs That Actually Lead
The GammaEdge Market Trend Model integrates three signal sets that historically lead price rather than confirm it.
1. Net dealer gamma regime
Positive vs negative GEX is the fundamental volatility character of the market and shifts roughly twice a month on average. The regime determines whether dealer flows are dampening or amplifying moves. Regime flips lead price action because the flow direction reverses well before retail recognizes the new vol environment. See the dedicated GEX article for the underlying mechanism.
2. Aggregated dealer flow direction
Where dealers are net buyers and sellers across the curve, not just at individual strikes. A net dealer-short call position across an index suggests systematic upside hedging pressure when price rises. A net dealer-short put position suggests systematic downside hedging when price falls. The flow direction is set by where the inventory is concentrated, and it changes slower than price changes.
3. Breadth confirmation
Cross-asset and intra-index breadth signals that confirm or contradict the positioning read. Examples: advance-decline line vs SPX, the percentage of S&P 500 stocks above their 50-day MA, the ratio of new highs to new lows, sector-rotation signatures across XLK / XLF / XLV / XLE. Breadth that contradicts positioning is a warning that the positioning read may flip soon.
None of the three are price-only. All three lead price in normal regimes and remain readable in volatile regimes when momentum models fail.
How the Model Updates
The Market Trend Model is published in the GammaEdge web app weekly with intraday updates pushed to the Discord when conditions shift materially. Members see the current read, the inputs, and the historical conditions that match the current setup. That last part, "this configuration has appeared X times since 2018; here is what happened next," is the difference between a model and a guess. Conditional probability attached to a directional bias is what makes the bias actionable.
The four model states
- Bullish, high conviction: all three inputs align bullish, historical match-set wins 60%+ of the time, average forward 5-day return positive.
- Bullish, low conviction: positioning bullish but breadth contradicts. Take long trades only with tight stops.
- Bearish, high conviction: all three inputs align bearish. Reduce long exposure, consider hedges or shorts.
- Mixed / chop: inputs disagree. Avoid directional bets, focus on premium-selling at structural levels.
What the Model Doesn't Do
It doesn't pick entries. It doesn't size positions. It doesn't tell you whether to buy SPX, sell QQQ, or sit out. What it does is establish the bias, and a bias backed by positioning data is dramatically more durable than a bias backed by chart pattern alone. The model is a filter, not a signal. The signal still comes from gamma walls, flow confirmation, and vanna posture on the day.
How Members Layer Trade Decisions On Top
The typical workflow:
- Sunday evening: check the Market Trend Model weekly read. Note the conviction level and the historical match-set.
- Monday open: build a watchlist of 5-10 candidates aligned with that bias. For bullish weeks, focus on liquid call-positioned single names; for bearish weeks, focus on put-positioned names.
- Daily: wait for intraday gamma walls, flow, or vanna setups to provide entries on watchlist candidates.
- Sizing: base on conviction -- distance to invalidation, not on emotion. High-conviction bullish week + tight invalidation = larger size. Mixed week + wide stop = smaller size.
- Friday review: compare actual week outcome to the model read. Update the historical match-set with this week's outcome.
A worked example: bullish high-conviction week
Sunday, model publishes: bullish, high conviction. GEX positive at +$2.1B and rising; dealer flow net short calls; breadth confirms (advance-decline expanding, 70% of S&P above 50-day). Historical match-set: 8 similar configurations since 2020, 6 wins (75%), average forward 5-day return +1.1%.
Trade plan: build a watchlist of 8 call-positioned single names (SPY, QQQ, NVDA, META, AMZN, GOOGL, AAPL, MSFT). Look for intraday entries at gamma support levels through the week. Size at 1% per name on tight stops. Total weekly exposure: 8% of account.
Outcome (typical): 6 of 8 names see meaningful upside in the week. Aggregate week return: +1.2%. The model did not pick entries; it set the playing field on which entries got chosen.
What can break the model
- Surprise geopolitical events. A flash war headline, a sudden bank failure, an unexpected central bank action. These override all three inputs simultaneously.
- Earnings clustering. A week with 6 megacap earnings reports has more idiosyncratic single-name flow than the model can fully process. Bias still holds at index level but single-name selection becomes harder.
- OPEX week edge effects. Monthly OPEX adds enormous gamma changes mid-week. The model adjusts for this but the noise is higher.
FAQ
Is the Market Trend Model the same as a price-action trend?
No. A price-action trend says "price is up" and infers strength. The Market Trend Model says "dealer positioning, dealer flow, and breadth all favor upside" and infers structural support for further strength. The former lags. The latter leads.
How often does it switch?
The regime component switches roughly twice a month on average. The full model state (bullish/bearish/mixed) can update intraday on big positioning changes but typically holds week-to-week.
Can I replicate the model myself?
Conceptually yes; practically only with a paid options data feed (ThetaData or equivalent) plus the time to maintain it. Most members find the subscription cheaper than the data feed alone.
What is the model's published track record?
The operator publishes the historical match-set conditional probabilities on each weekly update. Independent audit is not available; the framework is operator-attested. Treat the probabilities as conditional historical, not forward guaranteed.
Sources and further reading
- GammaEdge Market Trend Model documentation at gammaedge.com.
- SpotGamma research on regime classification.
- JP Morgan equity derivatives weekly commentary on dealer positioning.
Verdict
The Trend Model is not a magic ball. It is a disciplined integration of the data that actually moves markets, and that discipline is the closest thing retail traders have to an institutional weekly bias. A trader who uses it as the filter on top of their existing edge will take fewer low-conviction trades and more high-conviction ones. A trader looking for a single-indicator buy/sell signal will be disappointed; the model is explicitly not that.
What to do next
Stop trading the chart. Trade the flow.
WHAT
GammaEdge: the Whop community Taylor Drake runs. GEX dashboard, Discord bot, daily 9 a.m. ET session, wheel + P-Trans+GEX frameworks.
WHY
Same dealer-positioning data hedge funds pay 10x more for, packaged for active retail options traders.
HOW
14-day free trial. $0 charged today. 30-day refund: do not make a $150 trade in month one, get every dollar back.
Affiliate disclosure: GammaEdge is a paid product. We may earn a commission if you join through our Whop link, at no extra cost to you. All editorial assessments above are independent.