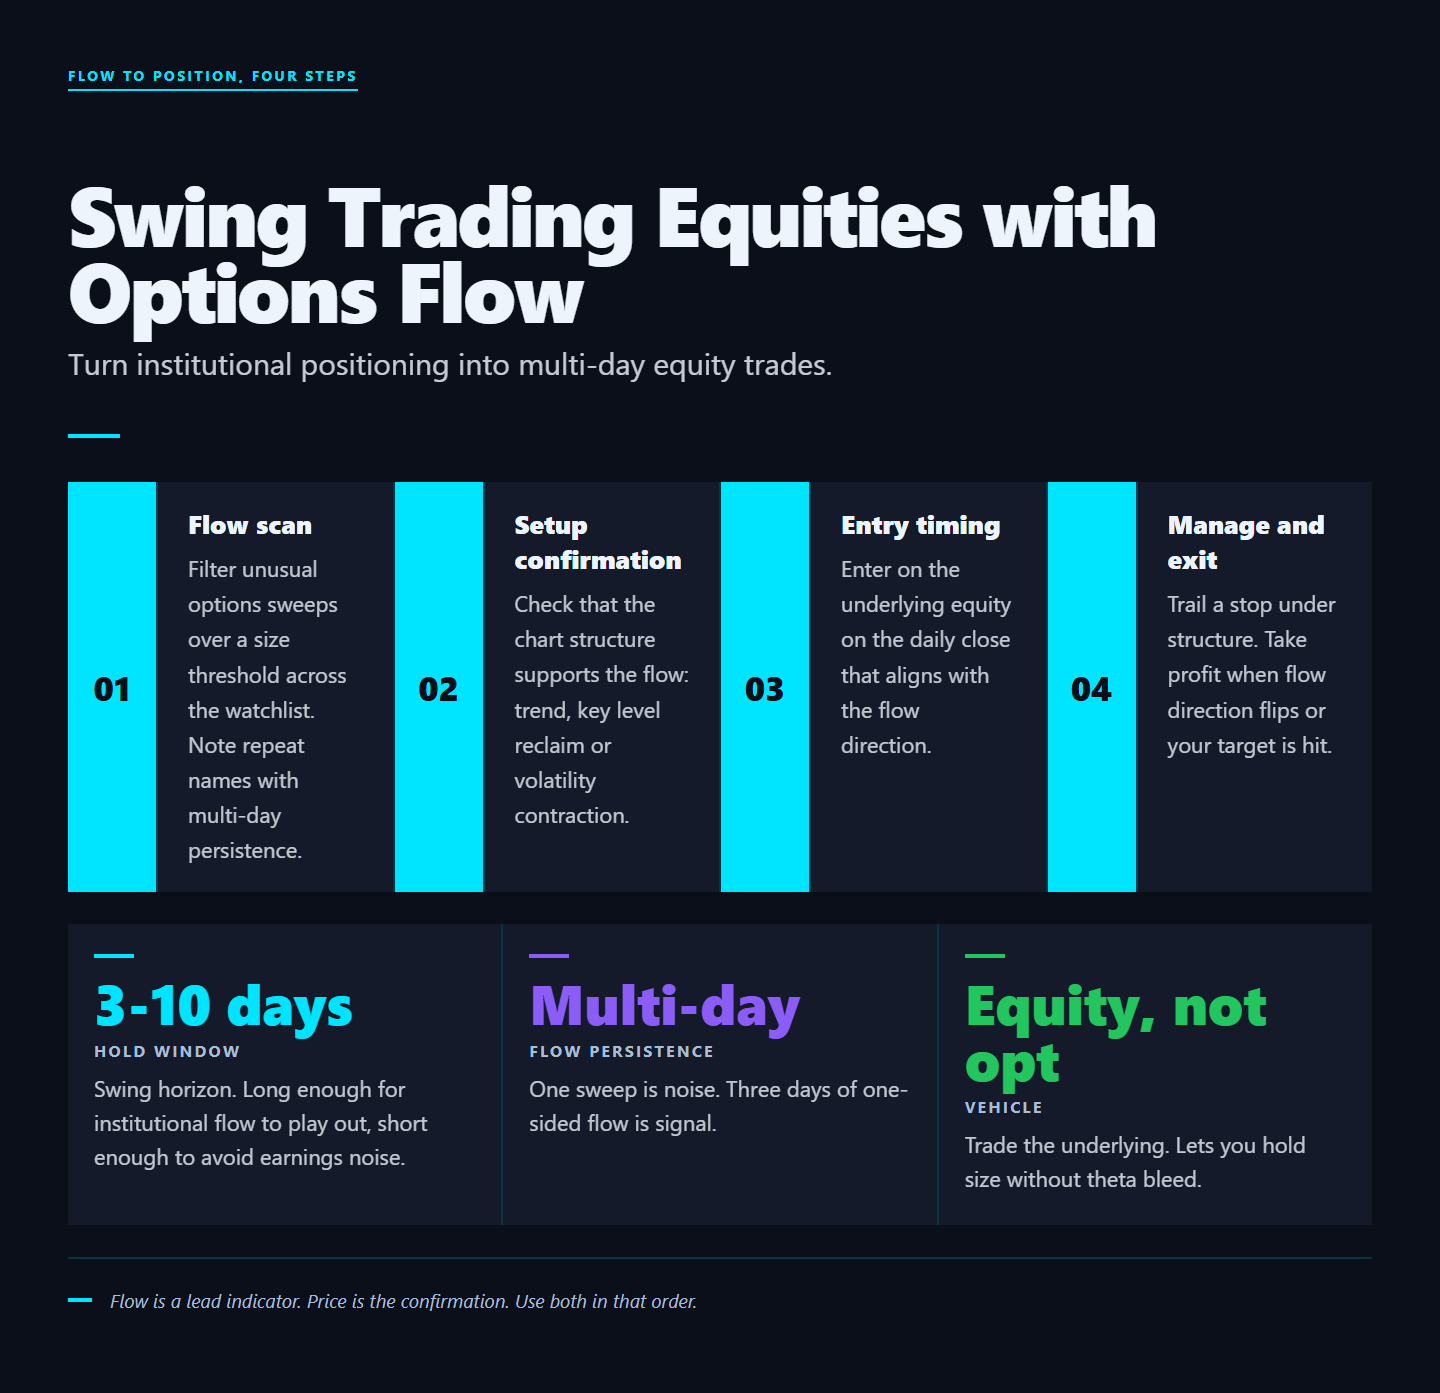
TL;DR. Most retail swing traders pick names on chart pattern alone and end up randomly distributed in outcomes. The fix is to invert the workflow: read options flow first, find the names with institutional positioning, then check the chart for entry levels. Fewer trades, higher conviction, better outcomes. This is the GammaEdge equity workflow in one paragraph.
Software Automated Research Team | Published 2025-04-16
The Swing Trader's Edge Problem
Single-name equity swing trading is harder than index trading because the noise is higher and the institutional participation is more variable. SPX trades roughly the same character every day driven by aggregate dealer flow. Single names trade wildly different characters depending on who is in the name on a given week. NVDA in March 2024 was a momentum vehicle; NVDA in March 2026 was a mean-reversion vehicle. The character changes based on who is positioned where.
Most retail swing traders pick names on chart pattern alone and end up randomly distributed in outcomes. The 60-day win-rate on chart-pattern-only swing trading approaches the random-walk baseline once costs are included. The way out is integrating options data into the entry process so you only take trades where institutional flow is already pointing in your direction.
What Options Flow Tells You About a Stock
Unusual options activity (large call or put orders that exceed average volume by multiples) is one of the most direct windows into institutional positioning available. When a hedge fund initiates a multi-month bullish position in a name, the options market often shows it days before the underlying breaks out. The mechanism: the fund cannot buy enough shares in the underlying without moving the price, so they accumulate via OTM call buying which is cheaper and signals less to the equity market.
The GammaEdge equity scanner flags these prints automatically and surfaces the ones that pass the community's filters: size, urgency, expiration, and whether they are aggressive bids or rolls of existing positions. The signal-to-noise ratio of raw "unusual options activity" feeds is poor (most prints are hedges or round-trips); the scanner filters down to the few that represent genuine new positioning.
The four flow types and what each means
- Aggressive call buying at the offer in 30-60 DTE expirations. Most common signal of new bullish positioning. Often a multi-week directional bet by a fund or family office.
- Aggressive put buying at the offer in 7-14 DTE expirations. Often a near-term hedge or short-term directional bet. Less reliable as a swing signal because the timeframe is too compressed.
- Stock-and-options pairing trades. Buying stock while selling deep-OTM puts (a synthetic long with built-in income) signals very high conviction. Rare but powerful.
- Spread trades (call verticals, put verticals). Defined-risk positioning that signals conviction with a specific price target. The target is the short strike. Useful for setting your own exit.
The Three Filters That Matter
- Size relative to average. A 5,000-contract order means little in a name that trades 50,000 contracts a day. It means a lot in a name averaging 2,000. Always normalize against the 30-day average volume on that specific strike and expiration.
- Expiration choice. 30-60 day expirations are typical for directional thesis trades. Weeklies are more often hedges or noise. Quarterly or LEAPS are slow-money positioning that may not see follow-through for months.
- Aggression. Were the contracts bought at the offer or worked at the mid? Aggressive bids signal urgency. Mid-market prints often reflect negotiation or two-sided hedging that does not indicate directional conviction.
Building the Swing Setup
The full process inside the community:
- Scanner flags unusual flow in a name. 3-10x average daily volume, aggressive aggressor side, 30-60 DTE.
- Cross-reference with current gamma profile. Does the name have dealer positioning that supports the directional thesis? A bullish call print into a short-gamma dealer book is a much stronger signal than a bullish call print into a balanced dealer book.
- Confirm with chart structure. Is there a clean technical level for risk? A bullish setup wants a recent higher-low or a clear support shelf for the stop.
- Size based on risk to invalidation, not feel. If the stop is 4% away, size at 0.5% account risk = 12.5% position. If the stop is 2% away, size at 0.5% account risk = 25% position. Math first, conviction second.
- Manage with rules. Pre-defined trailing stop, target, or time-based exit. Do not improvise in the heat of the move.
A worked example: NVDA bullish swing
Monday 11 a.m. ET. NVDA prints 75,000 contracts of 140-strike calls expiring in 45 days. Average volume on that strike: 6,000. Multiple: 12.5x. Prints at the offer. OI confirms the build (up from 25,000 to 95,000 by EOD). Gamma profile: dealers net short at 135-150 zone (will be forced to buy on any rally). Chart: NVDA at 138 with a recent higher-low at 134 (clean stop level).
Trade plan: long NVDA at 138.50 with stop at 133.80 (3.4% away). Account-risk size 0.5% = 14.7% position. Target: 148 (gamma flip zone), trail-stop to breakeven at 142, partial profit-take at 145.
Outcome over 8 trading days: NVDA rallies 138 -> 144 -> 142 -> 147 -> 146 -> 149 -> 148 -> 151. Partial profit-take at 145 captures half the position; trailing stop on the second half exits at 149 on day 7. Combined trade return: roughly 6% on the position, or ~0.9% account-level.
The key point: the trade was sourced from flow, confirmed by gamma profile, sized by chart-distance, and exited by rule. Zero discretionary "feel" was required after the initial trade plan.
Where Most Swing Traders Go Wrong
They flip the order. They start with the chart, fall in love with the setup, and only check flow as confirmation. The result is confirmation bias: they cherry-pick the flow data that supports the thesis they already have. The standard pattern is: see a bullish flag on NVDA, decide to go long, look at flow and find "well, there is some bullish call buying", enter the trade. The flow check was theater. The decision was made before the data was consulted.
Inverting the order (flow first, chart second) forces you to take only the setups the data is already pointing at. Fewer trades, higher conviction, better outcomes. The discipline is in saying no to chart setups that do not have flow behind them.
The three other common mistakes
- Chasing the flow signal late. By the time "unusual options activity" hits a Twitter feed, the original print is hours old. Be the source, not the downstream consumer.
- Buying the options the institution bought. Rookie mistake. The institution's option position has different decay, different leverage, and different breakeven than your account. Trade the underlying or a defined-risk structure of your own design.
- Skipping the invalidation level. A swing trade without a defined stop is a position you will hold all the way to zero. Always have a level that says "thesis wrong, exit."
FAQ
How many swing trades per week?
Most active members run 3-8 swing trades per week. The discipline filter cuts the count vs chart-only traders by roughly half, which sounds bad but is the point: higher conviction, less round-tripping, less account whip.
What is a reasonable hold time?
5-15 trading days for the typical swing setup. Anything shorter is intraday or news-driven. Anything longer crosses into position trading territory and requires different filters.
Should I use options or shares for the entry?
Defaults: shares for simplicity and to avoid theta/IV exposure. Defined-risk option structures (debit spreads, call verticals) if the IV environment is reasonable and you want leverage. Single-leg long options only if you have a strong directional view and accept the binary outcome.
Where does the flow data come from?
Institutional options feed (ThetaData, EdgeRater) inside the GammaEdge platform. Free retail "unusual options activity" feeds exist but lag, filter poorly, and miss the aggressor-side detail that makes the signal usable.
Sources and further reading
- CBOE academic research on institutional vs retail options flow signatures.
- Cremers and Weinbaum (2010) "Deviations from Put-Call Parity and Stock Return Predictability" on flow-based signals.
- GammaEdge equity-scanner documentation at gammaedge.com.
Verdict
The GammaEdge equity workflow is not glamorous. It is filter, confirm, size, manage, repeat. The result is a swing trading approach that compounds because the inputs are real positioning data, not opinions about chart patterns. A trader who internalizes the flow-first sequencing will trade less, hold higher conviction, and produce better month-over-month equity curves than the same trader using chart-only setups. That is the whole pitch in one paragraph.
What to do next
Stop trading the chart. Trade the flow.
WHAT
GammaEdge: the Whop community Taylor Drake runs. GEX dashboard, Discord bot, daily 9 a.m. ET session, wheel + P-Trans+GEX frameworks.
WHY
Same dealer-positioning data hedge funds pay 10x more for, packaged for active retail options traders.
HOW
14-day free trial. $0 charged today. 30-day refund: do not make a $150 trade in month one, get every dollar back.
Affiliate disclosure: GammaEdge is a paid product. We may earn a commission if you join through our Whop link, at no extra cost to you. All editorial assessments above are independent.