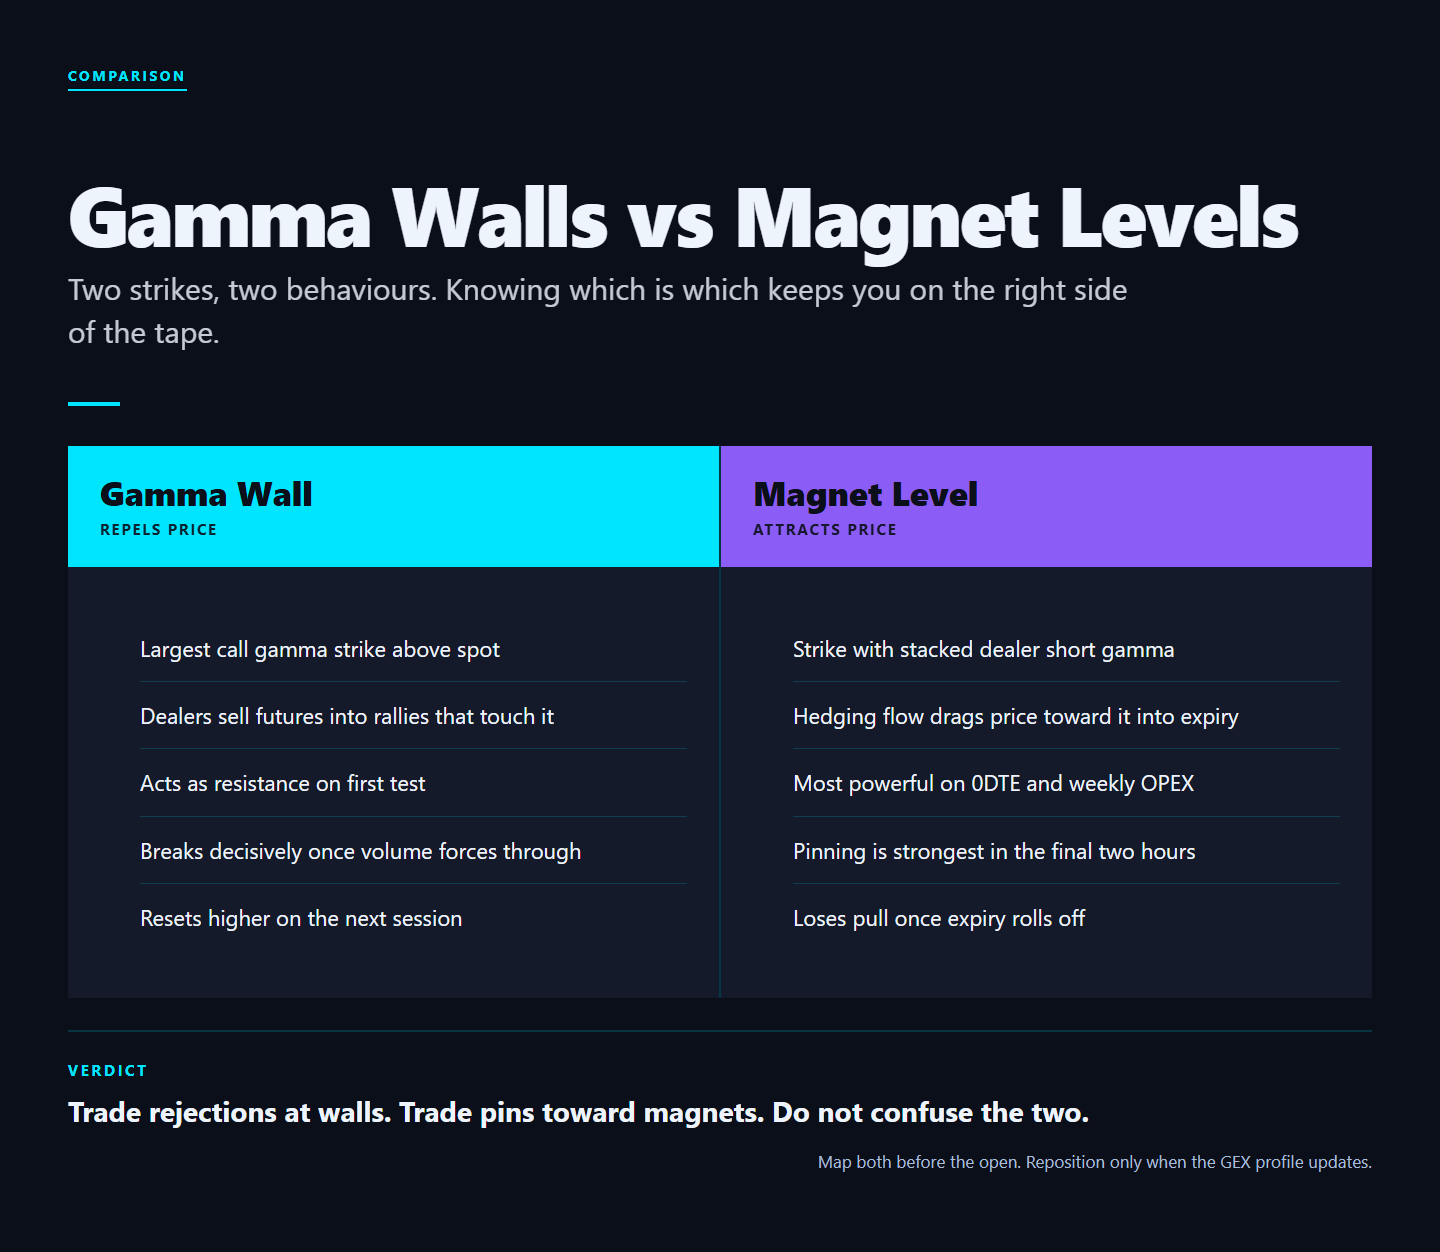
TL;DR. Gamma walls are strikes with enough dealer-side open interest that hedging at that level dominates other order flow. They act as mechanical support and resistance because dealers are forced to buy weakness and sell strength near them. Magnets pull price toward a strike on expiration day; walls force price to break through to keep moving. Confusing the two is the single most expensive intraday mistake retail traders make.
Software Automated Research Team | Published 2025-03-18
What a Gamma Wall Actually Is
A gamma wall is a strike with so much net open interest that dealer hedging at that level dominates other flows in the area. Above current price, a heavy call strike becomes a barrier: dealers sell stock into strength capping the move. Below current price, a heavy put strike becomes a floor: dealers buy weakness defending the level. The wall is not a drawn line on a chart. It is a mechanical commitment by dealers to hedge in a specific direction at a specific price.
Walls are visible in dealer-positioning data well before they are visible on the chart. By the time a wall shows up as a clear S/R level on a 5-minute candle, the morning OI calculation has already told you it would be there. This is why morning prep on options-driven instruments is non-negotiable for serious traders.
How To Find Them Without a Bot
Pull SPX (or any active underlying) open interest by strike for the nearest expiration. Multiply each strike's OI by 100 by the strike's gamma per contract. Sum calls separately from puts. The strikes with the largest absolute gamma exposure are your walls. The math is simple. The data is the bottleneck.
Inside GammaEdge, the Discord bot does this in milliseconds and updates intraday. You type the command, you get the map. Most members start their day by pulling it before they even look at a chart. Outside GammaEdge, you can build the same calculation off a CBOE end-of-day options file plus a Python script, but you sacrifice intraday refresh.
The four data points you need per strike
- Strike price. Obvious but critical for distance-to-price calculations.
- Open interest. Number of contracts outstanding.
- Gamma per contract. Computed from Black-Scholes given current spot and IV.
- Net dealer position direction. Inferred from open-interest changes and aggressor-side trade analysis. The hardest part to estimate without a feed.
Magnets vs Walls
A magnet is a strike that price drifts toward through expiration day, usually because dealer hedging on both sides of it requires them to stabilize price near that level. A wall is a strike price has to break through to continue trending, and breaking through accelerates the move because dealer hedges flip direction abruptly.
Confusing the two is a common retail mistake. Selling premium against a magnet is profitable. Selling premium against a wall that is about to break is how accounts disappear. The difference between the two is not the OI size; it is the distribution of OI around the strike. A magnet has roughly balanced call/put OI on both sides. A wall has lopsided OI with most of the weight pointing one direction.
How to tell them apart in 30 seconds
Pull OI for the nearest expiration. For the strike in question, look at the strike one above and one below. If both adjacent strikes have meaningful OI of the opposite type (puts above a call wall, calls below a put wall), it is more likely a magnet because dealers will hedge into the level. If adjacent strikes have weak OI or same-direction OI, it is more likely a wall because dealers need to defend a single level and a break flips their entire hedge.
The Three Conditions Walls Usually Hold
- Positive GEX day. Dealers are absorbing flows. Walls hold. Premium-selling at the walls makes money. This is the textbook positive-gamma intraday playbook.
- OI is concentrated, not distributed. A wall built from one strike is stronger than five smaller strikes in a cluster. Concentrated OI is concentrated hedging obligation; distributed OI is diffuse hedging that can be absorbed by other flow.
- No major event pending. Macro shocks override positioning. Walls fail when news enters. If you have CPI in three hours, do not bet on the wall holding through the print.
The Three Conditions Walls Tend to Break
- Negative GEX day. Dealers are amplifying flows. Walls become trampolines, not floors.
- OI distributed across a cluster. When wall OI is split between 4-5 strikes, no single defense holds. Price slices through.
- Stretching toward the wall on momentum. If price is approaching the wall with rising volume and tightening spreads, the break is more probable than the hold.
When Walls Break
The most explosive intraday moves happen when a gamma wall breaks in a negative GEX environment. Dealers were short gamma, the wall fails, and the hedging flow that was capping the move now accelerates it. These are the "no-news, huge candle" sessions retail traders find baffling but which are entirely predictable from positioning data the morning of.
A worked example: the negative-gamma break
SPX opens at 5470 with GEX at -$1.2B. The call wall sits at 5500 with 90,000 contracts of OI concentrated at that single strike. Adjacent strikes (5495 and 5505) have only 8,000 contracts each. Distribution: highly concentrated. By 11 a.m. SPX has rallied to 5495 on broad strength. At 5498 dealer flow flips: instead of selling against the wall (positive-gamma behaviour), dealers in this negative-gamma regime must buy to neutralize the explosively rising delta on their short calls. The wall does not just fail; the failure flow itself accelerates the move. SPX gaps to 5515 by 11:15 a.m. Volume confirms the break. Members who knew the regime entered long at 5494 with a stop at 5482. Members who did not got run over selling premium into the break.
How to size around walls
Two simple rules: (1) Premium-selling at a wall in positive-gamma regime can be sized normally because the wall holds. (2) Premium-selling at a wall in negative-gamma regime should be sized 50% or less of normal, with mandatory hard stops. The asymmetric blow-up risk in negative-gamma wall-break scenarios is the most common single source of large losses in retail options accounts. Walls do not break often, but when they do they break violently.
FAQ
How often does a wall hold vs break?
In positive-gamma regimes, walls hold the meaningful majority of the time. In negative-gamma regimes, they hold much less frequently and break more violently when they do. The regime is the dominant variable; the wall itself is secondary.
Are walls visible on the chart or just in OI data?
They become visible on the chart only after the third or fourth touch. By then the move is mature. The advantage of reading OI directly is identifying the wall before price has visited it.
Do walls work outside SPX?
Yes for SPY, QQQ, and the most liquid single names (NVDA, TSLA, AAPL, AMZN, META, MSFT). Less liquid names have walls but the OI concentrations are too small to dominate other flow.
How do I track wall changes intraday?
OI updates from the exchanges arrive overnight, but intraday flow data can be used as a proxy. Heavy new-strike call buying near a level erodes the wall as new positions absorb dealer-side exposure. The GammaEdge flow command surfaces this in real-time.
Sources and further reading
- CBOE options open-interest data and daily delta sheets.
- Garleanu, Pedersen, and Poteshman (2009) on demand-based option pricing and dealer hedging.
- GammaEdge wall-mapping documentation at gammaedge.com.
Verdict
Walls give you the map. The map gives you the plan. The plan is what separates members from spectators. The mistake is treating walls as static technicals and the trade is recognizing them as live dealer obligations that hold under one regime and break under another. Internalize that distinction and you stop fighting the wall and start trading the regime.
What to do next
Stop trading the chart. Trade the flow.
WHAT
GammaEdge: the Whop community Taylor Drake runs. GEX dashboard, Discord bot, daily 9 a.m. ET session, wheel + P-Trans+GEX frameworks.
WHY
Same dealer-positioning data hedge funds pay 10x more for, packaged for active retail options traders.
HOW
14-day free trial. $0 charged today. 30-day refund: do not make a $150 trade in month one, get every dollar back.
Affiliate disclosure: GammaEdge is a paid product. We may earn a commission if you join through our Whop link, at no extra cost to you. All editorial assessments above are independent.