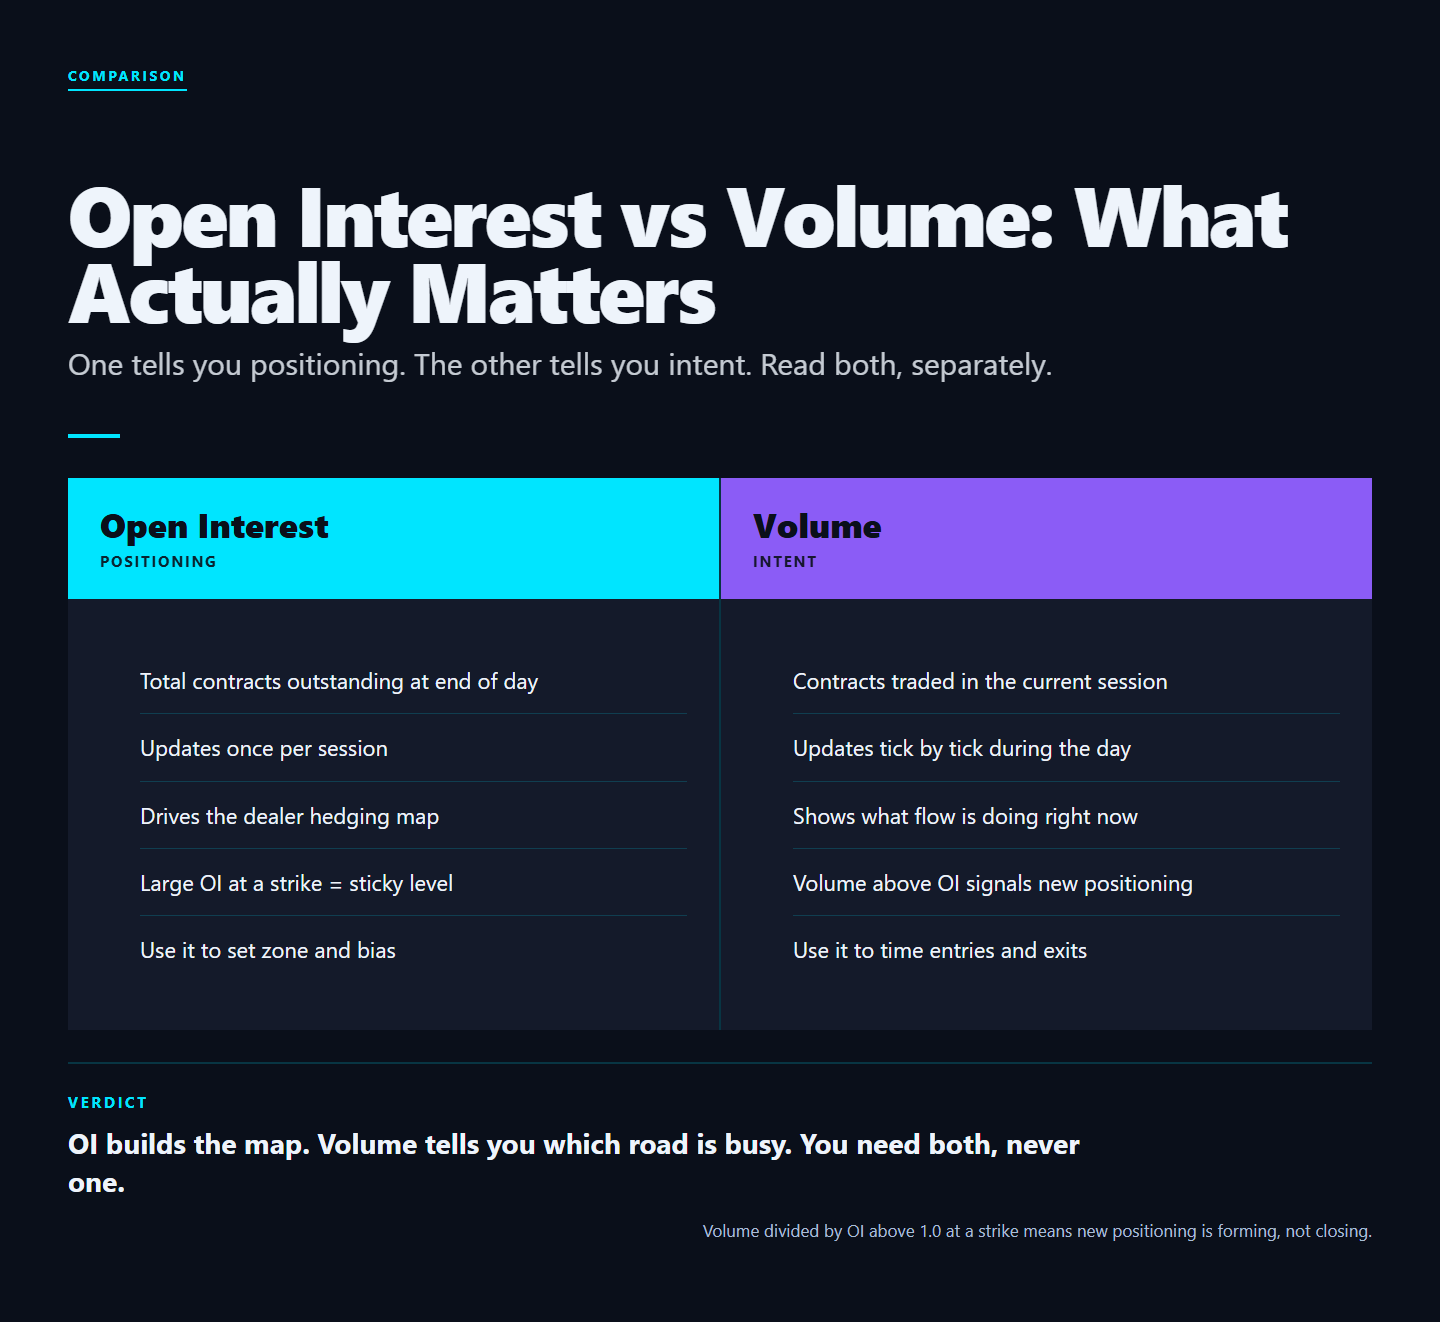
TL;DR. Volume is what traded today. Open interest is what is still on the books. They measure fundamentally different things, and confusing them is the most common analytical mistake in options. OI drives dealer hedging math because it is the persistent exposure dealers must manage. Volume only matters when it is unusual relative to history and skewed directionally. Read OI as structure, volume as texture, and most "anomalies" become tradable signals.
Software Automated Research Team | Published 2025-04-02
Two Numbers, Two Different Worlds
Open interest counts open contracts. Volume counts transactions during the session. A single contract can be traded a hundred times in a day. That is volume of 100, but open interest only changes when a new position is opened or an existing one is closed. This sounds like a textbook distinction but it has direct practical consequences for how you read flow data.
Imagine SPY 550 calls show 80,000 daily volume but the OI stays flat at 50,000. That means roughly 30,000 contracts of net round-tripping happened (buyers and sellers exchanging existing inventory) and no new aggregate position was built. Now imagine the same 80,000 volume with OI rising from 50,000 to 110,000. That is 60,000 contracts of net new positioning. The first scenario is noise. The second scenario is structural. Same volume number, completely different meanings.
Why OI Drives Positioning Math
Dealer hedging requirements scale with open interest, not volume. A strike with 50,000 OI exerts gamma pressure regardless of whether anyone traded it today. A strike with 200,000 daily volume but no OI growth had a lot of round-trip activity but does not change the positioning map. Dealer inventory is determined by cumulative open positions across the chain, not by the activity that happened to flow through the order book on any given session.
This is why GEX, gamma walls, and dealer flow models are built on OI. Volume is texture; OI is structure. A model built on volume reacts to noise. A model built on OI reacts to commitment.
The gamma-weighted OI calculation
Gamma exposure at a strike is roughly OI -- 100 -- gamma per contract. The 100 is the contract multiplier. The gamma per contract depends on strike distance from spot, time to expiry, and IV. Two strikes with identical OI can have wildly different gamma weights if one is ATM and the other is deep OTM. This is why raw OI charts are misleading without gamma weighting.
When Volume Becomes the Signal
Volume matters when it is unusual relative to historical norms and skewed directionally. A single name printing 5x average call volume with the prints on the offer is a signal of institutional positioning. The GammaEdge flow command flags exactly these (size, urgency, direction) without you having to scrape it manually.
The four ingredients of a real volume signal
- Multiple of average. 3-10x average daily volume is the sweet spot. Below 3x is noise. Above 10x can be a single trader unloading.
- Aggressor side. Volume printed at the ask (calls) or bid (puts) suggests urgency. Volume mid-market suggests negotiation or hedging.
- Expiration choice. 30-60 DTE expirations suggest directional thesis. Weeklies often suggest hedging or short-term speculation.
- OI confirmation. Volume that produces matching OI growth is new positioning. Volume that does not move OI is round-trip.
The Three Mistakes Traders Make
- Trading volume spikes without context. Volume without OI growth often means closing activity, not new positioning. Buying a single name on a "unusual volume" alert without verifying OI growth is one of the most common ways retail traders end up exit liquidity for institutions that are unwinding.
- Ignoring OI shifts. A 30% OI build at a specific strike overnight is a real positioning event. It usually happens for a reason. Watch it, especially in the 5-15 days before earnings or a known macro event.
- Treating ATM OI the same as OTM OI. Gamma weighting matters. 10,000 ATM contracts move dealer books far more than 100,000 deep OTM contracts because gamma at the money is an order of magnitude higher than gamma 10% out of the money.
- Ignoring OI on the wrong expiration. A 90-day OI build matters for swing trades. A 0DTE OI build matters for intraday. Mixing the two leads to bad inferences.
A worked example: OI vs Volume on NVDA
Tuesday afternoon, 2 p.m. ET. NVDA prints 50,000 contracts of the 140-strike calls expiring in 30 days. Average daily volume on that strike: 8,000. Multiple of average: 6.25x. Prints at the offer. Mid-cap call OI is rising rapidly intraday from 35,000 to 80,000+ as the prints continue. All four signals (multiple, aggressor, expiration choice, OI confirmation) are aligned. This is institutional positioning, not retail noise.
Trade plan: cross-reference with NVDA gamma profile. If dealers are short gamma in NVDA at the 135-145 zone (likely given the 140 call build), the institutional position is being absorbed by short-gamma dealers who will be forced to buy NVDA on any rally. Long NVDA at 137 with a stop at 134 and target 142+ becomes a structurally-supported swing trade.
Outcome over the next 5-10 trading days: NVDA rallies into 142-145 on multiple sessions, and dealer hedging amplifies each up-day. Members who took the trade based on the OI+volume confirmation extracted the move. Members who saw only the volume spike and bought single calls at 140 strike with 30 DTE made more on the trade but took more risk and got chopped on the intraday whips.
Building a Daily Routine
Inside the community, the workflow is:
- Pre-market: scan overnight OI changes for unusual builds. The GammaEdge OI command flags strikes with 25%+ OI growth on the prior session.
- Open: cross-reference any flagged strikes with current price and the gamma profile. New OI at strikes 2-5% away from current price is most consequential.
- Intraday: watch the flow command for confirmation or contradiction of overnight builds. If the overnight build was hedging, intraday flow will be mixed; if it was positioning, intraday flow tends to continue.
- Close: log new OI levels for next-day reference. Track them across a week to spot building institutional positions.
The OI/Volume framework in one paragraph
If you read only this paragraph: OI tells you what dealers are forced to hedge. Volume tells you what just happened. OI changes overnight reflect overnight positioning. Volume changes intraday reflect intraday flow. Use OI to build your structural map (walls, magnets, regime). Use volume to confirm direction in real-time. Never use volume alone to infer positioning, and never assume OI is static across the session.
FAQ
Where do I get end-of-day OI data?
CBOE publishes end-of-day options data; third-party providers (ThetaData, ORATS, IVolatility) sell historical OI with various granularity. Free retail brokers typically show OI on the option chain but only the prior day's settled number.
Why does OI update overnight?
OCC settles open positions overnight after the close. Intraday "OI" displayed in retail tools is usually the prior session's settled number. True intraday position changes have to be inferred from flow analysis.
How big does an OI shift need to be to matter?
For an active strike: a 25-50% overnight change is meaningful. A 100%+ change is a clear positioning event. For a thin strike where 1,000 contracts is normal, a 5,000-contract overnight build is enormous.
Does OI matter for selling premium?
Yes. Selling premium against a wall in positive-gamma regime works because the wall holds. Selling premium at a strike with low OI offers no structural defense. Premium-sellers should always check OI alongside the chart.
Sources and further reading
- CBOE options chain documentation on OI vs volume reporting.
- OCC end-of-day open-interest settlement methodology.
- GammaEdge OI command documentation at gammaedge.com.
Verdict
The traders who treat OI as structural and volume as texture consistently outperform the ones who chase volume spikes. The bot makes the structural read mechanical; the discretion is in execution. If you take only one habit from this article: never trade an "unusual volume" alert without checking whether OI confirmed it. That single filter cuts the noise rate on flow-based signals by more than half.
What to do next
Stop trading the chart. Trade the flow.
WHAT
GammaEdge: the Whop community Taylor Drake runs. GEX dashboard, Discord bot, daily 9 a.m. ET session, wheel + P-Trans+GEX frameworks.
WHY
Same dealer-positioning data hedge funds pay 10x more for, packaged for active retail options traders.
HOW
14-day free trial. $0 charged today. 30-day refund: do not make a $150 trade in month one, get every dollar back.
Affiliate disclosure: GammaEdge is a paid product. We may earn a commission if you join through our Whop link, at no extra cost to you. All editorial assessments above are independent.